It is useful to have a local Prometheus instance running to test the instrumentation of your application. If you are running the application on your machine, you need to make sure the Prometheus container can talk to the host machine. This is a short post detailing this setup.
Configuration
Firstly, let's create a Prometheus configuration with the needed scrape config.
# A list of scrape configurations.
scrape_configs:
  # The job name assigned to scraped metrics by default.
  - job_name: 'fennel-metricsdemo'

    # How frequently to scrape targets from this job.
    scrape_interval: 5s

    # The HTTP resource path on which to fetch metrics from targets.
    metrics_path: "/api/metrics"

    # List of labeled statically configured targets for this job.
    static_configs:
      # The targets specified by the static config.
      - targets: ['host.docker.internal:7071']
        # Labels assigned to all metrics scraped from the targets.
        labels:
          app: 'demo-app'
Since we are running this locally, you need to target your local machine. With Docker on Mac I had to target host.docker.internal and my application (an Azure Function) is running locally on port 7071.
Now that we have our configuration, we can use this to start our Docker container, mounting the configuration as a volume.
docker run --rm -it -p 9090:9090 -v /path/to/your/prometheus.yml:/etc/prometheus/prometheus.yml prom/prometheus
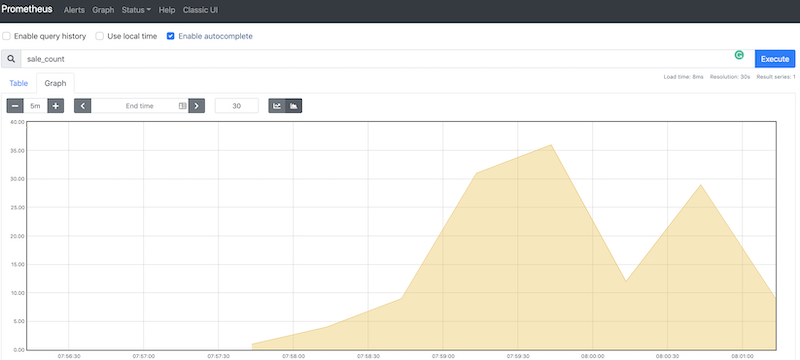
Prometheus should now be up and running and if your application is emitting metrics, you can go see them by navigating to http://localhost:9090/graph.
Conclusion
I will be making use of this in an upcoming post I plan to release soon. In my next post though I will look at using Datadog instead of a Prometheus server. I hope you find this useful.
Photo by Gleb Lukomets on Unsplash