In the previous post we looked at setting up a local Prometheus container to scrape metrics to test the observability setup of an application locally. A lot of companies I have worked with in recent years are using hosted observability solutions like Datadog. Although Datadog is typically a push based collector, a little known feature is that the agent can scrape from a Prometheus endpoint. In this post we will look at a simple setup for this locally.
To get started you need to have the Datadog agent installed.
Once you have the agent installed, you will need to edit openmetrics.d/conf.yaml. On my Mac this is found in /opt/datadog-agent/etc/conf.d/openmetrics.d/conf.yaml.
Optionally, you can launch the agent's Web UI. On my install it is at http://127.0.0.1:5002/.
- Click Checks > Manage Check Checks
- If openmetrics.d/conf.yaml is not available, select Add Check from the select box (NOT prometheus.d/conf.yaml)
- Configure the yaml value shown below.
You can find the docs here
init_config:
  ## Every instance is scheduled independent of the others.
  instances:

    ## @param prometheus_url - string - required
    ## The URL where your application metrics are exposed by Prometheus.
    #
  - prometheus_url: http://localhost:7071/api/metrics

    ## @param namespace - string - required
    ## The namespace to be prepended to all metrics.
    #
    namespace: azure.functions

    ## @param metrics - list of strings - required
    ## List of metrics to be fetched from the prometheus endpoint, if there's a
    ## value it'll be renamed. This list should contain at least one metric.
    #
    metrics:
      - demo_*
It is important that you specify which metrics you want to scrape. For this reason it is useful to prefix your metrics with an app name. In the example above I have updated my metrics to all start with demo_.
Once done editing the conf.yaml, restart your Datadog agent.
Using the Web UI to check that metrics are flowing from your application is useful at this point. The most details can be seen by navigating to Status > Collector. Scroll down until you see the Open Metrics section. Check that metrics sample is increasing (values do not update without a refresh).
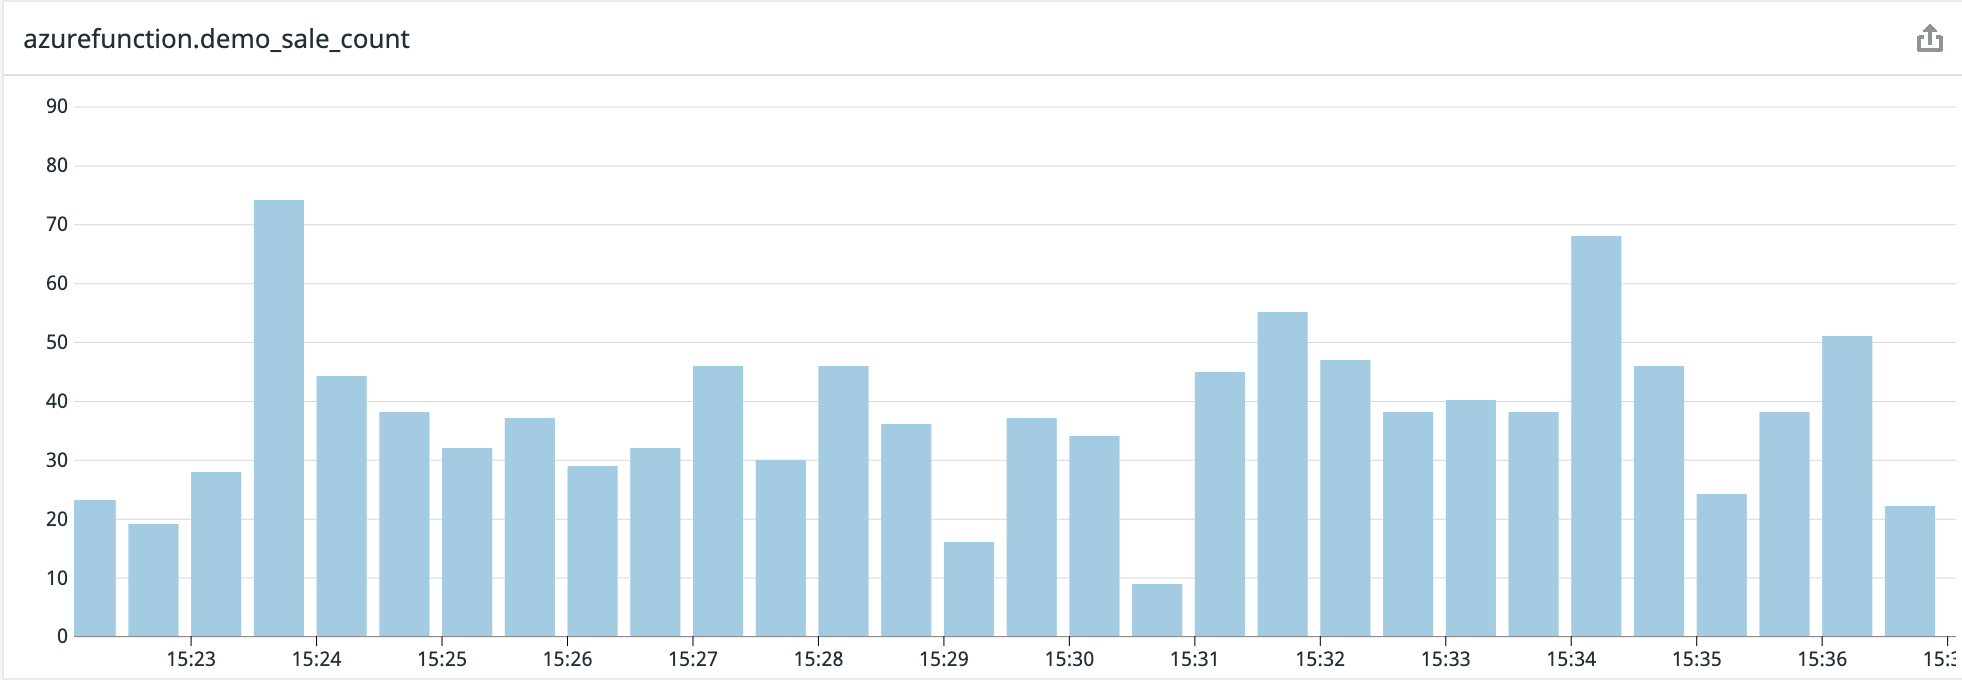
Once values are flowing to Datadog, you can go and view them in Datadog.
Conclusion
Datadog allows you to have a mix of push and pull metrics if you have applications that were built with different strategies. This is a really nice touch rather than having different places where applications are monitored. In my next post I will be showing how you can use this to monitor custom events in Azure Functions from Datadog.